Programming & IT Tricks . Theme images by MichaelJay. Powered by Blogger.

Copyright

Facebook

Post Top Ad

Search This Blog

Post Top Ad

Responsive Ads Here

Archive

Post Top Ad

Contact


Editors Picks

Follow us

Post Top Ad

Fashion

Music

News

Sports

Food

Technology

Featured

Videos

Fashion

Technology

Fashion

Label

Translate

About

Translate

Sponsor

test

Weekly

Comments

Recent

Connect With us

Over 600,000+ Readers Get fresh content from FastBlog

About

Showing posts with label Uber. Show all posts

Saturday, January 6, 2018

What we learned about productivity from analyzing 225 million hours of working time in 2017


This post was originally published on the RescueTime blog. Check us out for more like it.
When exactly are we the most productive?
Thinking back on your last year, you probably have no idea. Days blend together. Months fly by. And another year turns over without any real understanding of how we actually spent our time.
Our mission at RescueTime has always been to help you do more meaningful work. And this starts with understanding how you spend your days, when you’re most productive, and what’s getting in your way.
In 2017, we logged over 225 million hours of digital time from hundreds of thousands of RescueTime users around the world.
By studying the anonymized data of how people spent their time on their computers and phones over the past 12 months, we’ve pinpointed exactly what days and times we do the most productive work, how often we’re getting distracted by emails or social media, and how much time a week we actually have to do meaningful work.
Key Takeaways:

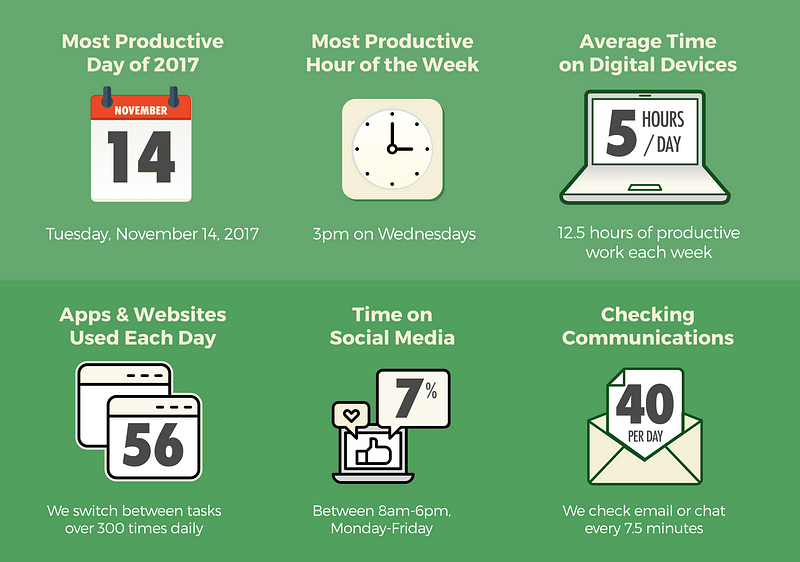
What was the most (and least) productive day of 2017?

Simply put, our data shows that people were the most productive on November 14th. In fact, that entire week ranked as the most productive of the year.
Which makes sense. With American Thanksgiving the next week and the mad holiday rush shortly after, mid-November is a great time for people to cram in a few extra work hours and get caught up before gorging on Turkey dinner.
On the other side of the spectrum, we didn’t get a good start to the year. January 6th — the first Friday of the year — was the least productive day of 2017.

Now, what do we mean when we talk about the “most” or “least” productive days?
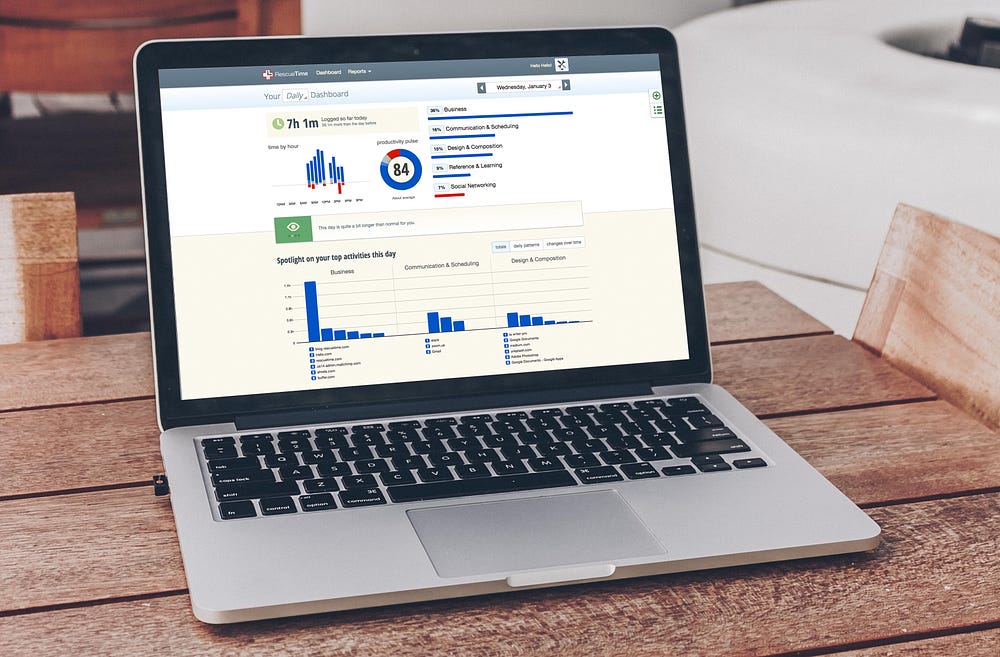
RescueTime is a tool that tracks how you spend your time on your computer and phone and let’s you categorize activities on a scale from very distracting to very productive. So for example, if you’re a writer, time spent in Microsoft Word or Google Docs is categorized as very productive while social media is very distracting.
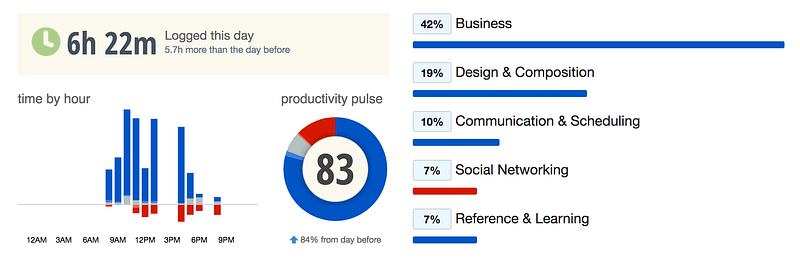
From that data, we calculate your productivity pulse — a score out of 100 for how much of your time you spent on activities that you deem productive.
On November 14th, the average productivity pulse across all RescueTime users was a not-so-shabby 60.

How much of our day is spent working on a digital device?

One of the biggest mistakes so many of us make when planning out our days is to assume we have 8+ hours to do productive work. This couldn’t be further from the truth.
What we found is that, on average, we only spend 5 hours a day working on a digital device.
And with an average productivity pulse of 53% for the year, that means we only have 12.5 hours a week to do productive work.

What does the average “productive day” look like?

Understanding our overall productivity is a fun exercise, but our data lets us go even deeper.
Looking at the workday (from 8am–6pm, Monday to Friday), how are we spending our time? When do we do our best work? Do different tasks normally get done at different times?
Here’s what we found out:

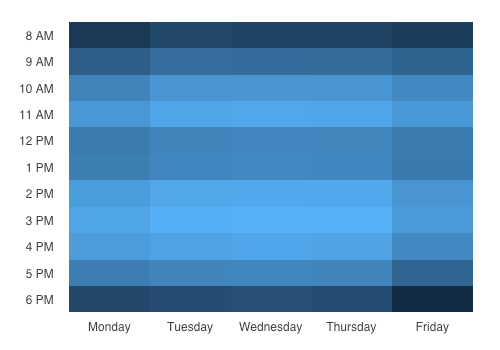
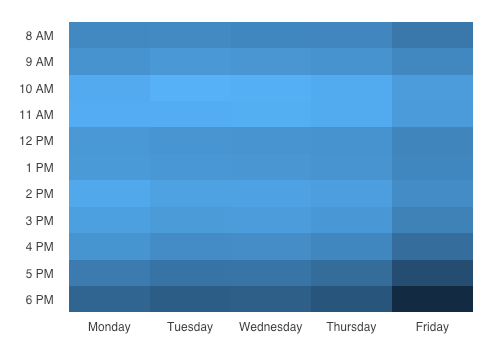
Our most productive work happens on Wednesdays at 3pm

Our data showed that we do our most productive work (represented by the light blue blocks) between 10 and noon and then again from 2–5pm each day. However, breaking it down to the hour, we do our most productive work on Wednesdays at 3pm.
Light blue represents our most productive work

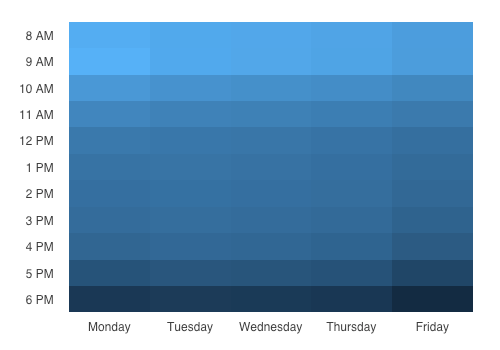
Email rules our mornings, but never really leaves us alone

Our days start with email, with Monday morning at 9am being the clear winner for most time spent on email during the week.
Light blue represents our busiest time for emails

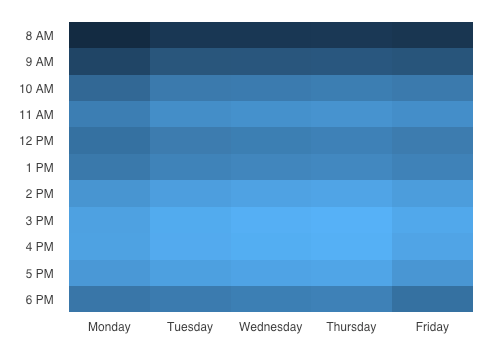
Software developers don’t hit peak productivity until 2pm each day

What about how specific digital workers spend their days?
Looking at the time spent in software development tools, our data paints a picture of a workday that doesn’t get going until the late morning and peaks between 2–6pm daily.
Light blue represents when we’re using software development tools

While writers are more likely to be early birds

For those who spend their time writing, it’s a different story.
Writing apps were used more evenly throughout each day with the most productive writing time happening on Tuesdays at 10am.
Light blue represents when we’re using writing tools

What were the biggest digital distractions of 2017?

It’s great to pat ourselves on the back about how productive we were in 2017. But we live in a distracted world and one of our greatest challenges is to stay focused and on task.
Here’s what our research discovered about the biggest time wasters of last year:

On an average day we use 56 different apps and websites

Depending on what you do, this number might not seem that bad. However, when we look at how we use those different apps and websites, things get a bit hairier.
When it comes to switching between different apps and websites (i.e. multitasking), we jump from one task to another nearly 300 times per day and switch between documents and pages within a site 1,300 times per day.

For Slack users, 8.8% of our day is spent in the app

There’s been a lot of talk about how much email and communication eats into our days. But what do the numbers look like?
What we found is that for people who use Slack as their work communication tool, they spend almost 10% of their workday in the app (8.8% to be exact).

We check email or IM 40 times every day

What’s more telling is how often we check our communication tools, whether email or instant messengers like Slack or HipChat.
On average, we check our communication apps 40 times a day, or once every 7.5 minutes during our 5 hours of daily digital work time.

Almost 7% of every workday is spent on social media

I’m sure most of us try not to spend time on social media while at work. But our data showed that almost 7% of every workday was spent on social media.
It’s not only time spent that’s the issue, however. On average, we check in on social media sites 14 times per workday, or nearly 3 times an hour during our 5-hour digital day.

So, what does all this tell us about how we spend our days?
Well, first off, we need to remember that averages shouldn’t be treated as universal truths. Everyone works differently. But having a high-level look at productivity and the things that get in its way is a powerful tool in improving how you work.
The biggest piece of advice we can pull from all this data is to be aware of the limited time you have each day for meaningful work, and spend it wisely.
Our days are filled with distractions, and it’s up to us to protect what time we have.

Friday, January 5, 2018

How we recreated Amazon Go in 36 hours


John Choi, me, our project apparatus, Ruslan Nikolaev, and Soheil Hamidi at our demo!
My colleagues and I wanted to create something that would make people go “wow” at our latest hackathon.
Because imitation is the sincerest form of flattery and IoT is incredibly fun to work with, we decided to create our own version of Amazon Go.
Before I explain what it took to make this, here’s the 3 minute demo of what we built!
There were four of us. Ruslan, a great full-stack developer who had experience working with Python. John, an amazing iOS developer. Soheil, another great full-stack developer who had experience with Raspberry Pi. And finally, there was me, on the tail end of an Android developer internship.
I quickly realized that there were a lot of moving parts to this project. Amazon Go works on the basis of real-time proximity sensors in conjunction with a real-time database of customers and their carts.
We also wanted to take things a step further and make the entry/exit experience seamless. We wanted to let people enter and exit the store without needing to tap their phones.
In order to engage users as a consumer-facing product, our app would need a well-crafted user interface, like the real Amazon Go.
On the day before the hackathon, I put together a pseudo-design doc outlining what we needed to do within the 36 hour deadline. I incorporated the strengths of our team and the equipment at hand. The full hastily assembled design doc can be seen below.

There were six main components to EZShop, our version of Amazon Go.
A quick diagram I whipped up visualizing the components of this project

The Kairos Facial Recognition API

The Kairos facial recognition API was a fundamental component for us. It abstracted the ability to identify and store unique faces. It had two APIs that we used: /enroll and /verify.
/enroll is described as:
Takes a photo, finds the faces within it, and stores the faces into a gallery you create.
We enrolled all new customers into a single “EZShop” gallery. A unique face_id attribute would be returned and stored with the customer’s registered name in our real-time database.
When we wanted to verify a potential customer’s image, we would POST it to the /verify endpoint. This would return the face_id with the highest probability of a match.
In a real-world implementation, it probably would have been a better idea to use a natively implemented facial recognition pipeline with TensorFlow instead of a network API. But given our time constraints, the API served us very well.

The Realtime Firebase Database

The Firebase database was another fundamental piece to our puzzle. Every other component interacted with it in real time. Firebase allows customized change listeners to be created upon any data within the database. That feature, coupled with the easy set-up process, made it a no brainer to use.
The schema was incredibly simple. The database stored an array of items and an array of users. The following is an example JSON skeleton of our database:
{
  "items": [
    {
      "item_id": 1,
      "item_name": "Soylent",
      "item_stock": 1,
      "price": 10
    }
  ],
  "users": [
    {
      "face_id": 1,
      "name": "Subhan Nadeem",
      "in_store": false,
      "cart": [
        1
      ]
    }
  ]
}
New users would be added to the array of users in our database after registering with the Kairos API. Upon entry or exit, the customer’s boolean in_store attribute would be updated, which would be reflected in the manager and personal app UIs.
Customers picking up an item would result in an updated item stock. Upon recognizing which customer picked up what item, the item’s ID would be added to the customer’s items_picked_up array.
I had planned for a cloud-hosted Node/Flask server that would route all activity from one device to another, but the team decided that it was much more efficient (although more hacky) for everybody to work directly upon the Firebase database.

The Manager and Personal Customer Apps

John, being the iOS wizard that he is, finished these applications in the first 12 hours of the hackathon! He really excelled at designing user-friendly and accessible apps.

The Manager App


This iPad application registered new customers into our Kairos API and Firebase database. It also displayed all customers in the store and the inventory of store items. The ability to interact directly with the Firebase database and observe changes made to it (e.g. when a customer’s in_store attribute changes from true to false) made this a relatively painless process. The app was a great customer-facing addition to our demo.

The Personal Shopping App


Once the customer was registered, we would hand a phone with this app installed to the customer. They would log in with their face (Kairos would recognize and authenticate). Any updates to their cart would be shown on the phone instantly. Upon exiting the store, the customer would also receive a push notification on this phone stating the total amount they spent.

The Item Rack, Sensors, and Camera

Soheil and Ruslan worked tirelessly for hours to perfect the design of the item shelf apparatus and the underlying Pi Python scripts.
The item rack apparatus. Three items positioned in rows, a tower for the security camera, and ultrasonic sensors positioned at the rear
There were three items positioned in rows. At the end of two rows, an ultrasonic proximity sensor was attached. We only had two ultrasonic sensors, so the third row had a light sensor under the items, which did not work as seamlessly. The ultrasonic sensors were connected to the Raspberry Pi that processed the readings of the distance from the next closest object via simple Python scripts (either the closest item or the end of the rack). The light sensor detected a “dark” or “light” state (dark if the item was on top of it, light otherwise).
When an item was lifted, the sensor’s reading would change and trigger an update to the item’s stock in the database. The camera (Android phone) positioned at the top of the tower would detect this change and attempt to recognize the customer picking up the item. The item would then instantly be added to that customer’s cart.

Entrance and Exit Cameras

I opted to use Android phones as our facial recognition cameras, due to my relative expertise with Android and the easy coupling phones provide when taking images and processing them.
The phones were rigged on both sides of a camera tripod, one side at the store’s entrance, and the other at the store exit.
A camera tripod, two phones, and lots of tape
Google has an incredibly useful Face API that implements a native pipeline for detecting human faces and other related useful attributes. I used this API to handle the heavy lifting for facial recognition.
In particular, the API provided an approximate distance of a detected face from the camera. Once a customer’s face was within a close distance, I would take a snapshot of the customer, verify it against the Kairos API to ensure the customer existed in our database, and then update the Firebase database with the customer’s in-store status.
I also added a personalized text-to-speech greeting upon recognizing the customer. That really ended up wowing everybody who used it.
The result of this implementation can be seen here:
Once the customer left the store, the exit-detection state of the Android application was responsible for retrieving the items the customer picked up from the database, calculating the total amount the customer spent, and then sending a push notification to the customer’s personal app via Firebase Cloud Messaging.

Of the 36 hours, we slept for about 6. We spent our entire time confined to a classroom in the middle of downtown Toronto. There were countless frustrating bugs and implementation roadblocks we had to overcome. There were some bugs in our demo that you probably noticed, such as the cameras failing to recognize several people in the same shot.
We would have also liked to implement additional features, such as detecting customers putting items back on the rack and adding a wider variety of items.
Our project ended up winning first place at the hackathon. We set up an interactive booth for an hour (the Chipotle box castle that can be seen in the title picture) and had over a hundred people walk through our shop. People would sign up with a picture, log into the shopping app, walk into the store, pick up an item, walk out, and get notified of their bill instantly. No cashiers, no lines, no receipts, and a very enjoyable user experience.
Walking a customer through our shop
I was proud of the way our team played to each individual’s strengths and created a well put-together full-stack IoT project in the span of a few hours. It was an incredibly rewarding feeling for everybody, and it’s something I hope to replicate in my career in the future.
I hope this gave you some insight into what goes on behind the scenes of a large, rapidly prototyped, and hacky hackathon project such as EZShop.

How Uber was made


Uber has transformed the world. Indeed, its inconceivable to think of a world without the convenience of the innovative ride sharing service. Tracing its origins in a market which is constantly being deregulated, Uber has emerged triumphant. Operating in over 58 countries and valued roughly at US$ 66 billion, Uber has rapidly expanded to established branches in over 581 cities in over 82 countries with the United States, Brazil, China, Mexico and India being Uber’s most active countries.
If that wasn’t impressive enough, in 2016 the company completed a total of 2 billion rides in one week. When you consider the fact that the first billion rides took Uber 6 years, and the second billion was garnered in a mere 6 months, it’s not surprising to see Uber emerge as a global business leader. This worldwide phenomenon is built on a simple idea, seductive in its premise - the ability to hail a car with nothing but your smartphone.
It took the problem of hailing a taxi and gave everyone an equitable solution while further capitalizing on the emerging market. And smart people are asking the right question: How do I build an app like Uber for my business needs?

Humble Beginnings

It all started in 2008, with the founders of Uber discussing the future of tech at a conference. By 2010, Uber officially launched in San Francisco. In 6 months, they had 6,000 users and provided roughly 20,000 rides. What was the key to their success? For one, Uber’s founders focused on attracting both drivers and riders simultaneously. San Francisco was the heart of the tech community in the US and was thus the perfect sounding board for this form of technological innovation to thrive.
In the beginning, Uber spread their App through word of mouth, hosting and sponsoring tech events, and giving participants of their events free rides with their app. This form of go-to-marketing persists today - giving 50% discounts to new riders for their first Uber ride. This initial discount incentivized users to become long term riders, and the rest was history. As more and more people took to social media to tell the world about this innovative new App - the sheer brilliance of their marketing strategy paid off.

Product Technology Cohesion: How Uber Works

What makes Uber, Uber? For one, it’s the ubiquitous appeal, or the way in which they streamlined their product, software and technology. It was, at the start, fresh, innovative, and had never been seen before. So if one were to replicate the model, they’d need to look at Uber’s branding strategy.
To use Uber, you have to download the app, which launched first on iPhone, then extended to Android and Blackberry.
Uber’s co-founders, Garret Camp and Travis Kalanick, relied heavily on 6 key technologies based on iOS and Android geolocation. What really sold it though, was its clear core value - the ability to map and track all available taxis in your given area. All other interactions are based on this core value - and its what sets Uber (and will set your app) apart from the crowd. To build an App like Uber, you’ll need to have:
1. Registering/Log-in features: Uber allows you to register with your first name, last name, phone number and preferred language. Once you’ve signed up, they’ll send you an SMS to verify your number, which will then allow you to set your payment preferences. Trip fares are charged after every ride through this cashless system.
2. Booking features: This allows drivers the option to accept or deny incoming ride requests and get information on the current location and destination of the customer.
3. The ability to Identify a Device’s location: Uber, via CoreLocation framework (for iOS platforms) obtains the geographic location and orientation of a device to schedule location and delivery. Understanding iOS and Android geolocation features is crucial for this step, because that’s what your App is running on.
4. Point to Point Directions: The Uber App provides directions to both the driver and the user. Developers of the Uber App use MapKit for iOS and Google Maps Android API for Android to calculate the route and make directions available. They further implemented Google Maps for iPhone and Android, but cleverly adapted technology from other mapping companies to solve any logistical issues that might come up.
5. Push Notifications and SMS: You get up to 3 notifications instantly from Uber when you book a ride.
  • A notification telling you when the driver accepts your request
  • One when the driver is close to your location
  • One in the off chance your ride has been cancelled
You further get the full update on your driver’s status, down to the vehicle make and license number, and an ETA on the taxi’s time of arrival.
6. Price Calculator: Uber offers a cashless payment system, paying drivers automatically after every ride, processed through the user’s credit card. Uber takes 25% of the driver’s fare, making for easy profit. They paired with Braintree, a world leader in the mobile payment industry, but other good options avaible are Stripe, or Paypal, via Card.io.
Here are few more much sought after features for the user’s side of the App:
  • The ability to see the driver’s profile and status: Your customers will feel safer being able to see your driver’s verification, and it’s makes good security sense to ensure you know who’s using your App for profit.
  • The ability to receive alerts: Receive immediate notifications about the status of your ride and any cancellations.
  • The ability to see the route from Their Phones (An In built Navigation system): This is intrinsically linked to your geolocation features, you want to be able to direct your taxis to the quickest, most available routes.
  • Price calculation: Calculating a price on demand and implementing a cashless payment system.
  • A “spilt fare” option: Uber introduced this option wit great success. It allows friends to spilt the price of the ride.
  • Requesting previous drivers: It’s a little like having your favourite taxi man on speed dial, and is a good way of ensuring repeat customers.
  • Waitlist instead of surge pricing: Avoid the media hassle of employing surge pricing by employing a wait list feature, so your users can be added to a waiting list rather than be charged more than they should, and to keep them from refreshing the App during peak hours, reducing the resources required by your backend infrastructure.
Another key to Uber’s success, that should be noted by potential developers of similar Apps, is the way in which Uber operates. They tap into more than one market which equates to more riders, more drivers, and more business for the company. Uber has mastered the art of localization - the ability to beat out pre-existing markets and competitors, which further retains their customer base by improving their own business strategy.
They’ve taken local context and circumstances into consideration. For example, they partnered with Paypal in November 2013 to provide as many people in Germany don’t use credit cards, and switched to services based on SMS messages in Asia as there are more people but fewer smart phones per capita. This helps them cater to various markets and and optimize profits.
The Uber marketing strategy isn’t static - it’s dynamic. Expansion was necessary, and the business model reaps profits from saturating the taxi market with their customers and drivers, driving their exponential growth. What aspiring App developers can take from this is that you need to design your App for flexibility.
Design your App in a way that’s going to let it take a hit and roll with punches. Having a system in place that allows you to build and integrate changes effectively within the App and allows team members to communicate effectively is of paramount importance.
What made Uber so successful was its ability to reshape how we think about technology and its operation. Indeed it made the market a better, more efficient place through the innovative on-demand service.

What Technology is Uber Built on?

The tech side of the App is written largely in JavaScript which is also used to calculate supply and predict demand. With the real time dispatch systems being built on Node.js and Redis. Java, as well as Objective-C is used for the iPhone and Android apps. Twilio is the force behind Uber’s text messages, and push notifications are implemented through Apple Push Notifications Service on the iOS platform and Google Cloud Messaging (GCM) for the Android App.

How much does Uber make?

Actually, it’s a lot less than you think. The $66 billion valuation, after the 25% commission (which rounds out to about $0.19 per ride) mostly goes towards credit card processing, interest, tax, compensation for employees, customer support, marketing, and various anti-fraud efforts.

How much does it take to build Uber?

Uber’s not just one App, it’s two - one for the rider and one for the driver. The cost of developing an App like Uber is dependent on a number of factors
  • the cost of building an MVP
  • product development and acquisition
  • getting the economics of marketing sorted
  • the constant cost of building on and improving your App’s analytic capabilities
When you make an App like Uber, you’ll invest a fair bit into design services, backend and web development, project management, not to mention Android and iOS native app development. The total man hours round out to around 5000 hours for similar on demand taxi Apps, which puts the cost of developing such an App to around $50,000 (assuming that your team works for $50 dollars an hour). However, since hourly rates roughly range from $20 to $150, median costs could be higher or lower.

Conclusion

To wrap up, Ubers success was due to several factors, including a clear business model and interaction based features, and not the other way around combined with a marketing strategy focusing on attracting users.
The question on everyone’s mind of course is how can you reduce the overall risk of failure by making sure that your idea and product are viable when you’re developing an App?
One way is to use a Mobile App development partner (such as Octodev) that has worked on many such Apps and understands the processes involved. An advance of using such a partner is they’ve worked on many such App development projects and have the practical experience in product development to avoid the pitfalls and make the most of your vision.
Octodev App Development Process
Another important part of ensuring that your App development project is swiftly and smoothly executed is having a clear road map and regular communication during the project. There are many approaches to achieve this and we, at Octodev, use a consultative approach to App development. We draw from our successful App implementations. Get in touch with us now if you want an accurate cost for your own Uber like App idea.
This article was originally published on the Octodev Blog.

Interested for our works and services?
Get more of our update !